
Sieve analysis is a practical method for determining the particle size distribution of powders, granules and other particulate materials.
Before applying the method, it helps to understand the purpose of sieve analysis in quality control and process decisions. For sand-specific testing, our guide to selecting mesh sizes for sand samples explains how mesh, millimeters and microns relate.
The method is straightforward: weigh a representative sample, pass it through a series of test sieves with progressively smaller openings, then weigh the material retained on each sieve. From these measurements, you can calculate the percentage retained, cumulative percentage retained and percentage passing at each sieve size.
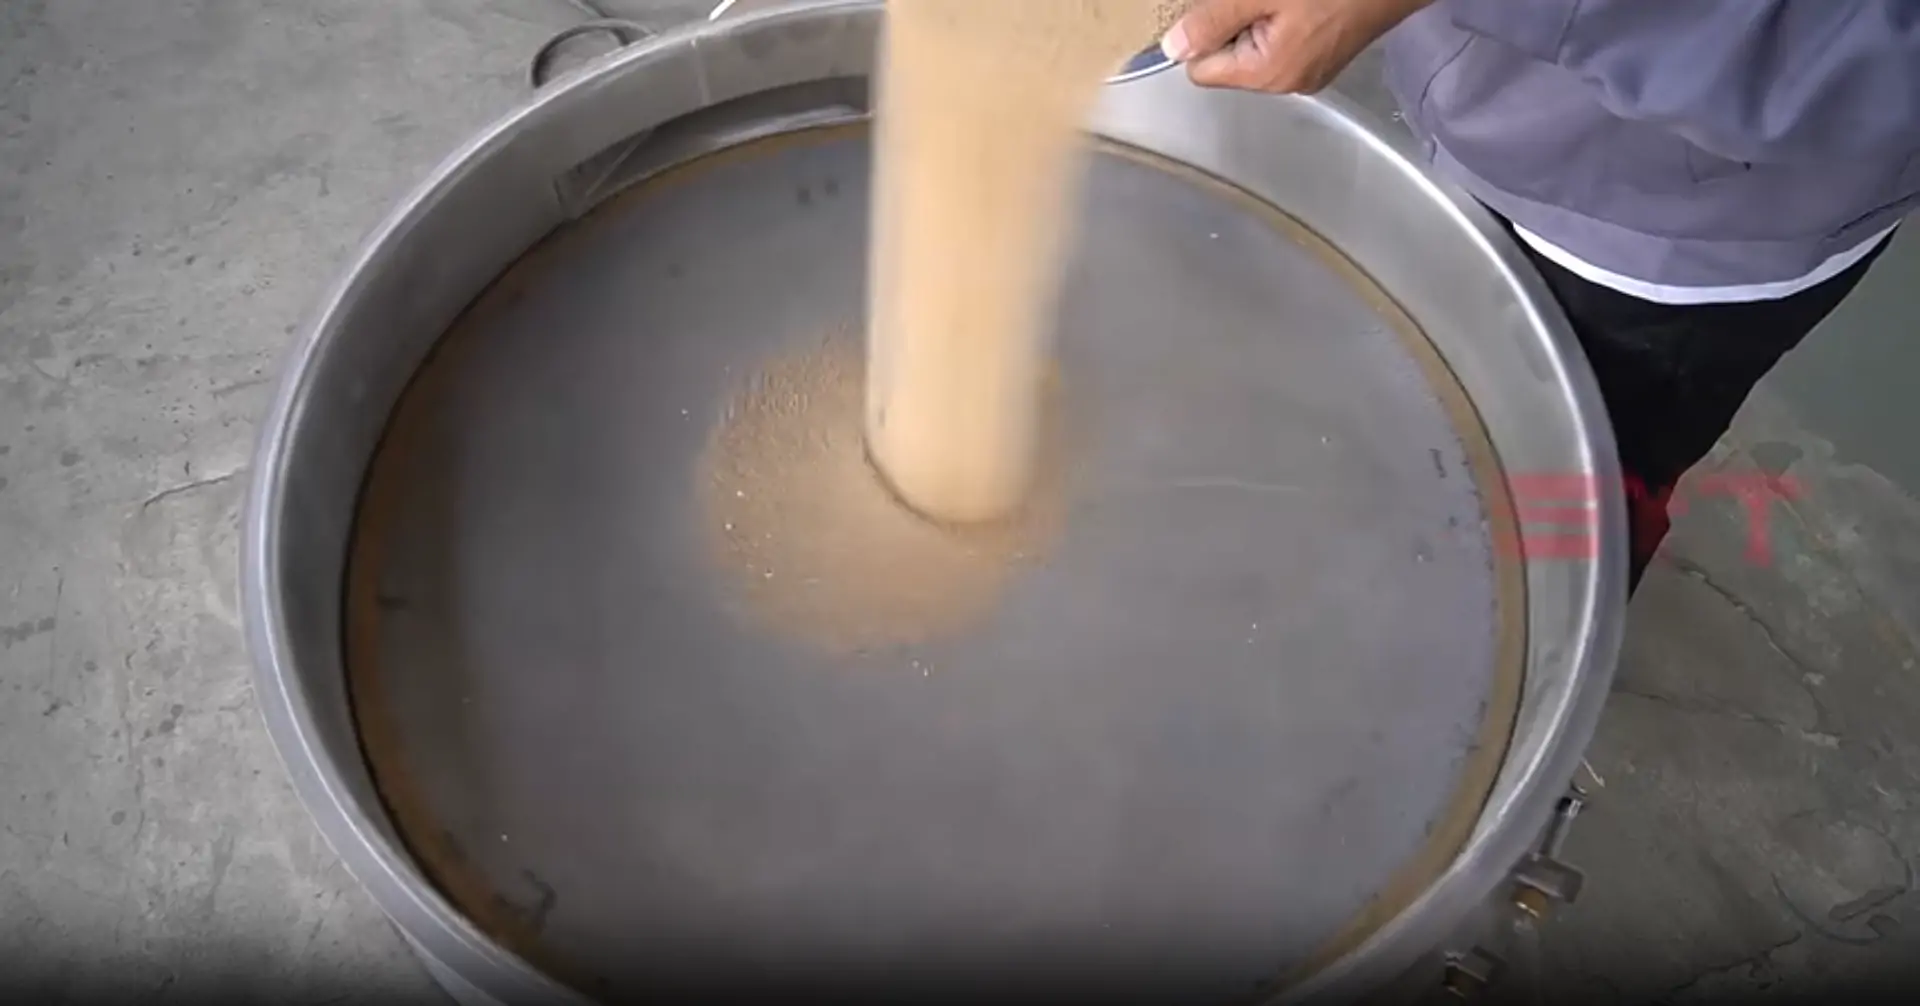
The principle is simple. Getting reliable results isn’t always that simple. Sample preparation, sieve selection, loading, test time, moisture and blocked openings can all affect the result. And when sieve analysis data is used to select an industrial screening machine, particle size is only one part of the picture.
This guide explains the complete process, from the basic sieve analysis procedure and calculations to interpreting the results for practical screening applications.
What Is Sieve Analysis?
Sieve analysis is a method used to determine the particle size distribution of a material by separating particles through sieves with known opening sizes.
A typical test uses several sieves stacked vertically. The sieve with the largest opening is placed at the top. Progressively smaller sieves are installed below it, followed by a collecting pan at the bottom. During sieving, smaller particles pass through the openings while larger particles are retained. After the test, the material on each sieve is weighed.
The result tells us how the original sample is distributed across different particle size ranges.
For example, if material passes through a 1 mm sieve but remains on a 500 μm sieve, that fraction lies approximately between those two sieve opening sizes.
This makes sieve analysis useful for checking whether a powder or granular material meets a defined particle size specification.
Why Is Sieve Analysis Important?
In production, sieve analysis is commonly used to:
- check incoming raw materials;
- compare different production batches;
- monitor crushing or milling results;
- identify excessive fines or oversized particles;
- verify a particle size specification;
- evaluate the performance of a screening process;
- provide particle size information before equipment selection.
Instead of describing a material simply as “fine” or “coarse,” you can determine what percentage of the sample is above or below specific sieve openings.
How Does Sieve Analysis Work?
The basic principle is physical separation by particle size.
A typical sieve stack is arranged like this:
Sample → Largest sieve opening → Medium sieve openings → Smallest sieve opening → Collecting pan
The sample is placed on the top sieve and the stack is subjected to a controlled sieving motion. Particles that are sufficiently small to pass through an opening move to the next sieve. Particles that cannot pass remain on that sieve. After sufficient sieving, each retained fraction is weighed separately.
These weights are then used to calculate the particle size distribution.
Equipment Needed for Sieve Analysis
A basic sieve analysis normally requires the following equipment:
| Equipment | Function |
|---|---|
| Test sieves | Separate particles according to opening size |
| Sieve lid | Prevent material from escaping during testing |
| Collecting pan | Collect material passing the smallest sieve |
| Balance | Weigh the original sample and retained fractions |
| Sieve shaker | Provide controlled and repeatable sieving motion |
| Sample divider | Help obtain a representative test portion |
| Cleaning tools | Remove particles without damaging the sieve |
For occasional or simple testing, sieves may be shaken manually where the applicable test method permits it. For routine testing, a mechanical sieve shaker can reduce differences caused by operators using different shaking motions or test conditions. The equipment alone, however, does not guarantee an accurate result. Sampling and test procedure are just as important.
Sieve Analysis Procedure: Step by Step
The exact procedure should follow the applicable material standard, test method or your internal quality-control procedure.
A general dry sieve analysis can be understood through the following steps.
Step 1: Obtain a Representative Sample
Start with a sample that actually represents the material you want to evaluate.
This is easy to overlook. Powders and granules can segregate during transport and storage. Coarser particles and finer particles may not remain evenly distributed throughout a container. Taking material only from the surface may therefore give a different result from testing the complete batch.
Where necessary, use an appropriate sampling and sample-reduction method before beginning the test.
Step 2: Check the Material Condition
Before sieving, look at the sample.
- Is it dry and free-flowing?
- Are fine particles sticking together?
- Are there visible agglomerates?
Moisture and agglomeration can prevent individual particles from passing through openings they would normally pass through.
Some test methods therefore require drying or other sample preparation before sieve analysis. Follow the procedure specified for the material being tested rather than applying one preparation method to every sample.
Step 3: Select the Test Sieves
Choose sieve openings that cover the particle size range you need to measure. Place the largest opening at the top and arrange the remaining sieves in descending opening size. The pan goes at the bottom.
The purpose is not to use as many sieves as possible. A useful sieve series should separate the sample into meaningful particle size fractions.
Step 4: Weigh the Initial Sample
Measure and record the sample mass before sieving.
- For example:
- Initial sample mass = 500 g
This value will be used later to calculate the percentage retained and percentage passing.
Step 5: Load the Sieve Stack
Place the sample on the upper sieve and install the lid. Avoid putting an excessive amount of material on a sieve. When the material layer becomes too deep, particles have less opportunity to reach the screen surface. This can slow separation and affect the final result.
If necessary, divide a large sample into suitable test portions according to the applicable procedure.
Step 6: Run the Sieve Test
Install the stack on the sieve shaker and run the test according to the required procedure.
Suitable test time depends on factors such as:
- particle size;
- particle shape;
- material properties;
- sieve opening;
- sample quantity;
- applicable test standard.
More time is not automatically better. Some friable materials can break down under prolonged mechanical action, changing the particle size distribution being measured.
Step 7: Weigh Each Retained Fraction
After the test, carefully remove the sieves one at a time. Collect and weigh the material retained on each sieve and in the bottom pan. Record every value. Finally, compare the total recovered mass with the initial sample mass.
A significant difference deserves investigation. Material may have been lost during transfer, remained in the equipment, or been incorrectly weighed.
If you have any questions about how to use the product, please contact us at Sanyuantang. Our technical staff will guide you through the process.
Sieve Analysis Calculation
Once the retained masses are known, the sieve analysis calculation is relatively simple.
Three values are commonly useful:
- Percentage retained
- Cumulative percentage retained
- Percentage passing
Percentage Retained
Use:
Percentage Retained = (Mass Retained on Sieve ÷ Initial Sample Mass) × 100
Suppose:
- Initial sample = 500 g
- Material retained on a 1.00 mm sieve = 75 g
Then:
(75 ÷ 500) × 100 = 15%
Therefore, 15% of the original sample was retained on that sieve.
Cumulative Percentage Retained
Cumulative percentage retained is the sum of the percentage retained on a particular sieve and all larger sieves above it.
For example, if:
- 5% is retained at 2.00 mm
- 15% is retained at 1.00 mm
then the cumulative percentage retained at 1.00 mm is:
5% + 15% = 20%
Percentage Passing
Percentage passing is calculated as:
Percentage Passing = 100 − Cumulative Percentage Retained
If cumulative retained is 20%, then:
Percentage Passing = 100 − 20 = 80%
So 80% of the sample passes that sieve opening.
Sieve Analysis Example
Here is a simple example using a hypothetical 500 g sample.
The values below are for calculation demonstration only.
| Sieve Size | Mass Retained | % Retained | Cumulative % Retained | % Passing |
|---|---|---|---|---|
| 2.00 mm | 25 g | 5% | 5% | 95% |
| 1.00 mm | 75 g | 15% | 20% | 80% |
| 500 μm | 150 g | 30% | 50% | 50% |
| 250 μm | 175 g | 35% | 85% | 15% |
| 125 μm | 60 g | 12% | 97% | 3% |
| Pan | 15 g | 3% | 100% | 0% |
| Total | 500 g | 100% | — | — |
What does this tell us?
At the 500 μm sieve, cumulative retention is 50%. Therefore, 50% of this example sample passes the 500 μm opening.
At 1.00 mm, 80% passes.
If a product specification required at least 90% of the material to pass 1.00 mm, this hypothetical sample would not meet that particular requirement.
This is why percentage passing is often more useful than looking at retained weight alone.
How to Read Sieve Analysis Results
A sieve analysis table describes the distribution of particles rather than giving only one particle size.
Suppose a specification says:
Minimum 95% passing 2.00 mm
You can compare the percentage passing at 2.00 mm directly with that requirement.
Or a specification might say:
Maximum 10% retained above 1.00 mm
In this case, cumulative retention can be used to check the material against the limit.
A particle size distribution can also help production teams understand what is happening upstream.
For example, an increase in oversized material may indicate a change in grinding, crushing or other processing conditions. An increase in fines may indicate a different issue.
The sieve result tells you what changed in the particle size distribution. Determining why it changed requires knowledge of the actual process.
Dry Sieve Analysis vs. Wet Sieve Analysis
Not every material should be tested in exactly the same way.
Dry Sieve Analysis
Dry sieving is suitable for many free-flowing powders and granular materials that can separate without liquid. It is straightforward and allows the retained fractions to be recovered easily.
Wet Sieve Analysis
Some fine particles tend to agglomerate or adhere to larger particles during dry sieving. Where an applicable test method allows it, wet sieving uses a suitable liquid to help disperse the material and move fine particles through the sieve openings. The liquid must be compatible with the sample, sieve and test requirements.
Wet sieving should not simply be chosen because dry sieving appears slow. The method should match the material and the applicable testing procedure.
Sieve Analysis Standards
For quality-control work, the sieve itself is part of the measurement system.
Two commonly referenced standards are ASTM E11 and ISO 3310-1.
- ASTM E11 specifies requirements for woven wire test sieve cloth and the design and construction of test sieves used to classify materials by particle size.
- ISO 3310-1 specifies technical requirements and test methods for test sieves made from metal wire cloth.
These standards primarily define requirements for the test sieves. They should not be confused with a complete test procedure for every material. The correct sieve analysis method may depend on the product or industry being tested. For example, aggregates, powders and other materials may have their own sampling, preparation and testing standards.
Always check which standard applies to your material before establishing a formal test procedure.
Common Errors That Affect Sieve Analysis Results
Sieve analysis is simple enough that small details are sometimes ignored. Those details can matter.
Sieve Overloading
Too much material creates a thick bed over the mesh. Particles may not reach the openings efficiently, leading to incomplete separation.
Poor Sampling
Even perfect sieving cannot correct a sample that does not represent the original material. For bulk materials, sampling is often one of the largest potential sources of error.
Moisture and Agglomeration
Fine particles can stick together and behave like larger particles. If this happens, the measured distribution may appear coarser than the actual distribution of individual particles.
Blocked Openings
Particles can lodge in the mesh and reduce the available open area. This is especially noticeable with particles close to the sieve opening size or materials that tend to stick.
Damaged Test Sieves
Worn, distorted or damaged openings can change which particles pass through. Test sieves should therefore be inspected and maintained according to the applicable quality procedure.
Inconsistent Test Conditions
Changing the test time, sample quantity, sieve stack or shaking conditions between samples makes comparison more difficult. Consistency matters when sieve analysis is used for routine quality control.
Sieve Analysis vs. Other Particle Size Analysis Methods
Sieve analysis is useful, but it is not the only particle size measurement method.
| Method | Principle | Typical Strength |
|---|---|---|
| Sieve analysis | Physical separation through known openings | Simple measurement of sieve-size fractions |
| Wet sieving | Liquid-assisted separation through sieves | Useful where permitted for difficult fine materials |
| Air jet sieving | Airflow assists passage through a sieve | Useful for certain fine dry powders |
| Laser diffraction | Particle size inferred from light scattering | Rapid analysis across fine particle ranges |
| Image analysis | Particle dimensions measured from images | Can provide size and shape information |
These methods do not necessarily produce directly interchangeable results because they measure particle size in different ways.
Choose the method according to the material, required size range, specification and purpose of the test.
From Sieve Analysis to Industrial Screening
This is where laboratory testing and production screening need to be separated clearly.
Sieve analysis measures particle size distribution. An industrial vibrating screen separates material during production.
The two are related, but they are not the same process.
Suppose sieve analysis shows that a powder must be separated at 500 μm.
That does not mean that knowing “500 μm” is enough to select a production machine.
For industrial screening, Sanyuantang normally needs additional application information such as:
| Information | Why It Matters |
|---|---|
| Required cut size | Determines the basic screen opening |
| Feed rate | Affects required screening area and machine size |
| Bulk density | Affects screen loading |
| Particle size distribution | Shows how much material must pass or be rejected |
| Moisture | Can increase sticking and mesh blinding |
| Particle shape | Influences passage through openings |
| Number of fractions | Determines the required number of screen decks |
| Material characteristics | Affect machine and contact-material selection |
Consider two materials that both require separation at 500 μm.
- Material A may contain only 5% above 500 μm.
- Material B may contain 40% above 500 μm.
The nominal separation size is identical, but the screening duty is clearly different.
This is why Sanyuantang does not recommend an industrial vibrating screen based on mesh size alone. Particle size distribution is useful input, but it should be considered together with actual capacity and material behavior.
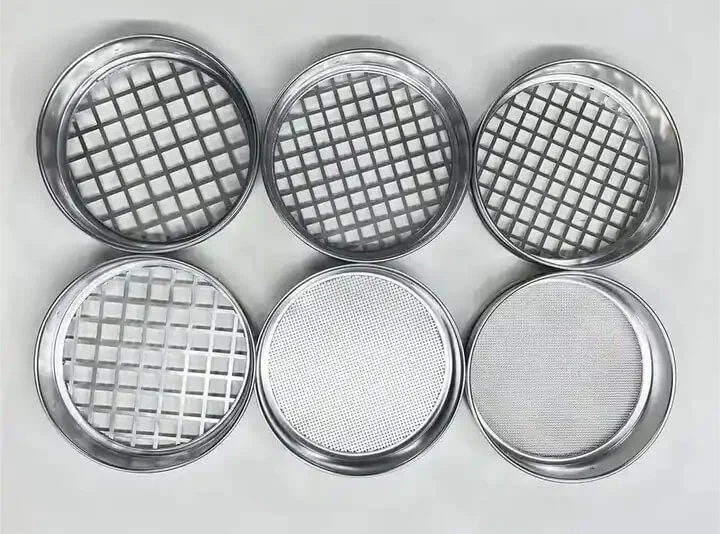
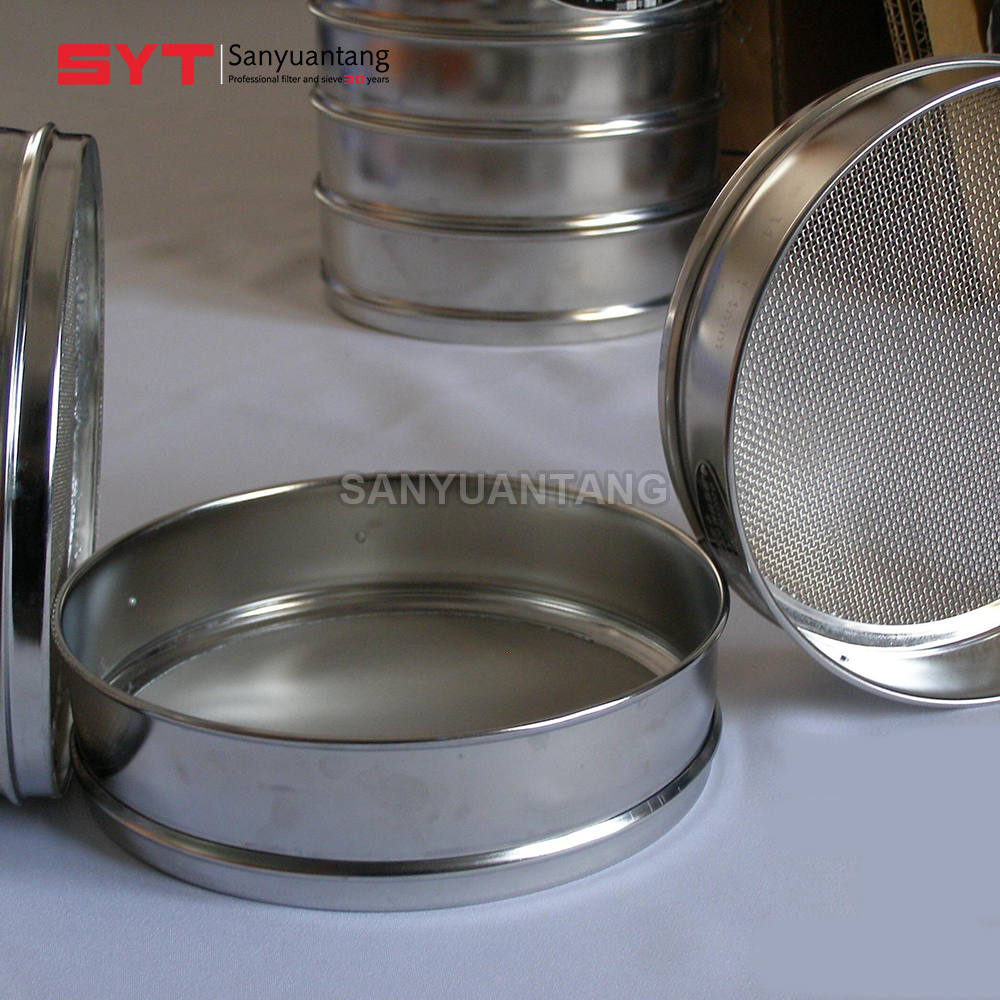
For laboratory particle-size testing, a test sieve shaker can be used with a stack of standard test sieves. For continuous or higher-capacity production, the screening equipment should be selected according to the actual process conditions.
Frequently Asked Questions About Sieve Analysis
What is sieve analysis?
Sieve analysis is a particle size testing method that separates a sample through test sieves with known opening sizes. The mass retained on each sieve is measured and converted into percentages to describe the particle size distribution of the material.
How do you perform a sieve analysis?
Prepare a representative sample, weigh it, arrange suitable test sieves from largest to smallest, place the sample on the upper sieve, perform the specified sieving procedure, then weigh each retained fraction and calculate the results.
How do you calculate percentage retained?
Divide the mass retained on a particular sieve by the initial sample mass and multiply by 100. If 50 g is retained from a 500 g sample, the percentage retained is 10%.
How do you calculate percentage passing?
First calculate cumulative percentage retained for the sieve. Subtract that value from 100. For example, if cumulative retention at a particular opening is 35%, then 65% of the sample passes that sieve.
How long should a sieve analysis run?
There is no universal test time for every material. Sieving time should follow the applicable standard or validated test procedure and depends on the sample, sieve opening, particle characteristics and equipment used.
What is the difference between dry and wet sieve analysis?
Dry sieving separates free-flowing material without liquid. Wet sieving uses a suitable liquid to help disperse and pass certain fine or agglomerating particles through the sieve when the applicable method permits it.
What causes inaccurate sieve analysis results?
Common causes include poor sampling, excessive sieve loading, moisture, agglomeration, blocked or damaged sieve openings, material loss during handling and inconsistent test conditions. The entire procedure should be checked when results are unexpectedly different.
Can sieve analysis help select a vibrating screen?
Yes. Particle size distribution and the required cut size are useful starting points. Industrial vibrating screen selection also requires information about capacity, bulk density, moisture, particle shape, material characteristics and the percentage of material near the required separation size.
Conclusion
Sieve analysis turns a sample into useful particle size data. A reliable result depends not only on weighing and calculation, but also on representative sampling, suitable test sieves and consistent test conditions.
For production screening, the analysis is a starting point rather than a complete equipment specification. Sanyuantang uses particle size information together with capacity and material characteristics when evaluating a suitable screening solution for an application.
About Sanyuantang
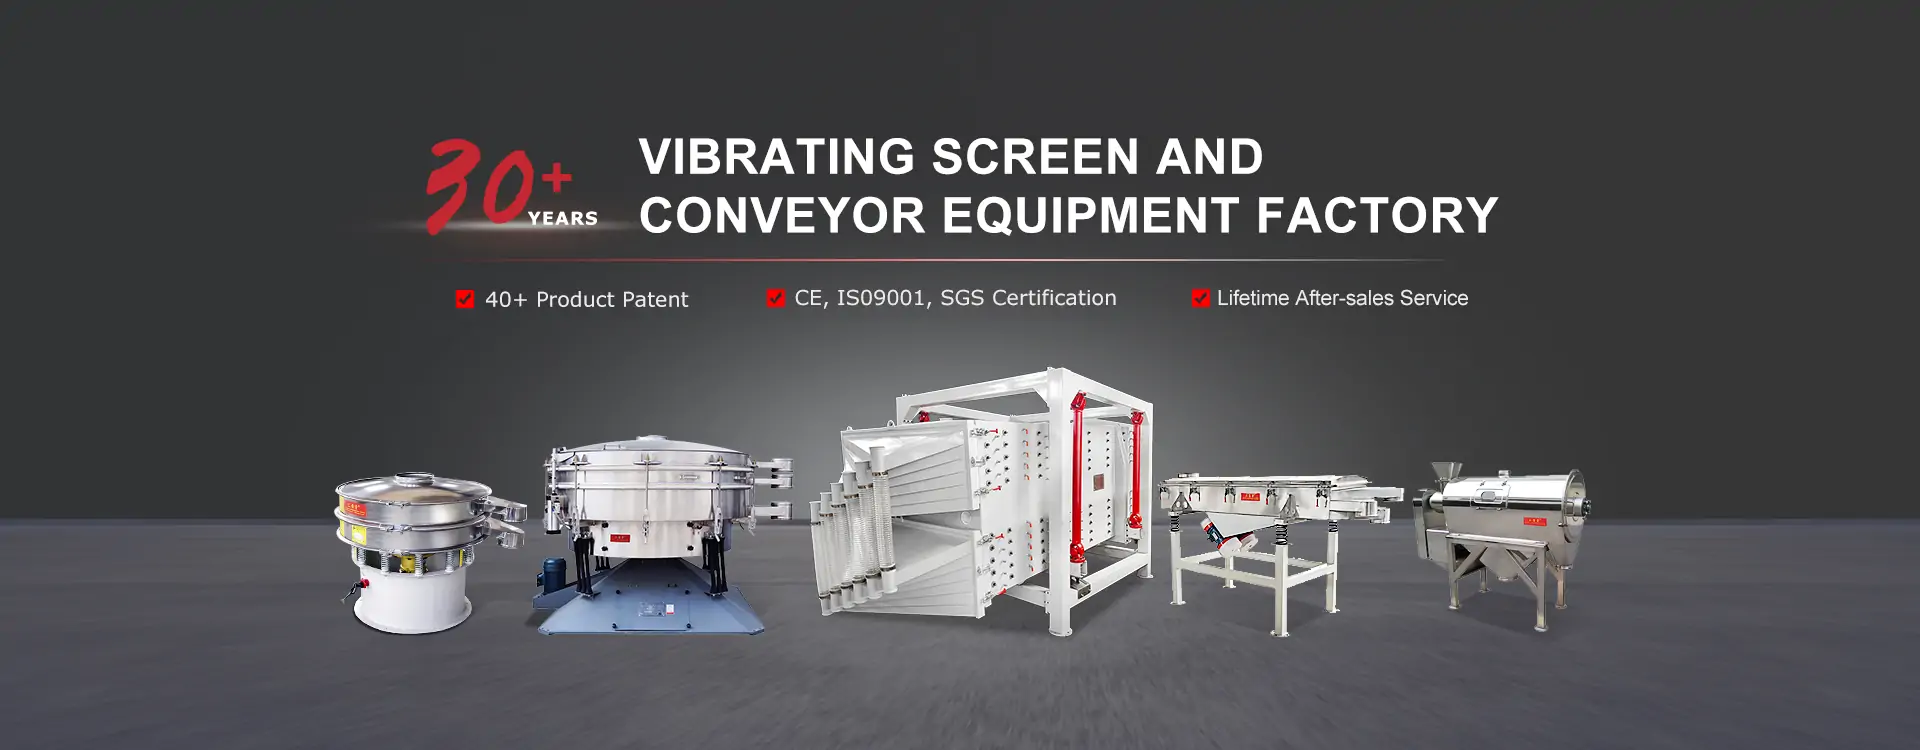
Sanyuantang has focused on screening and conveying solutions since 1994. For particle-size testing and production screening projects, our engineers review test data, capacity, bulk density, moisture, and material behavior before recommending equipment.
Learn more about Sanyuantang or review our industrial screening machines.
Discuss Your Screening Requirement
Send us the material name, particle-size distribution, required cut size, bulk density, moisture and target capacity. Our sales and engineering team can review the data and advise whether laboratory testing or a production screening trial is appropriate.
Email: info@sanyuantang.com
Phone: +86-18639095165